Between Any Two Points: six ideas, one plan and several cups of tea.
The First Postulate:
"A straight line can be constructed between any two given points." – Euclid.
...Okay...so here's my thinking…
A bike ride, the night sky, a stretch of coastline, an geeoetric tile pattern, a vector illustration: at their core, each is a mathematical construction. A list of ordered points across a space, communicating a meaning, data or a concept.
For some reason this has fascinated me since I was very young: seeing patterns, symmetry, hierarchy in something visual. Most of my adult life I have skirted around the topic in both career and creativity, close enough to admire it, never quite close enough to commit.
My goal...
At 40, it became clear. I wanted to build a machine that draws things I could tell it to draw, in ink, on paper. Not print. Draw. To dive headfirst into the art of maths and the mathematics of art. But reader, if you know me, you'll understand: I want to know it all. How the idea becomes repeated code, becomes mechanical movement, becomes art on tangible paper. Anything less would be sensible, and I have limited patience for sensible.
How the first month went…
I did what any reasonable adult does with a milestone birthday: asked for a microcontroller. Ollie, to his credit, delivered a Raspberry Pi Pico 2, with a grin on his face. A grown-up kit for my inner child, from the inner child of my partner.
It began with me learning the very basics: MicroPython, LEDs, resistors, potentiometers (a word I can now wire correctly but still cannot say). New skills like debugging dodgy breadboards, understanding the theory behind libraries, and small victories like making stepper motors turn actual degrees. Things were going well. I even used Claude to design me a bespoke set of 10 lessons and exercises that would walk me through my kit in a friendly language I understood while I got familiar with VS Code (no Thonny thank you very much), all backed up with clear rules that prevented it from just doing it for me (rude, occasionally frustrating, but guardrails are highly necessary).
It was going so well.
I could see my goal start to come alive in my mind's eye. I was daydreaming about fluoro pink Perspex cogs and epitrochoid vs. epicycloid spiro art (more on these in due course). The ideas and arty outputs were piling up in my imagination. So, naturally, were the gaps in my knowledge. So I did what designers do when confronted with an unfamiliar problem. I drew a diagram, felt significantly better about everything, and made a cup of tea.
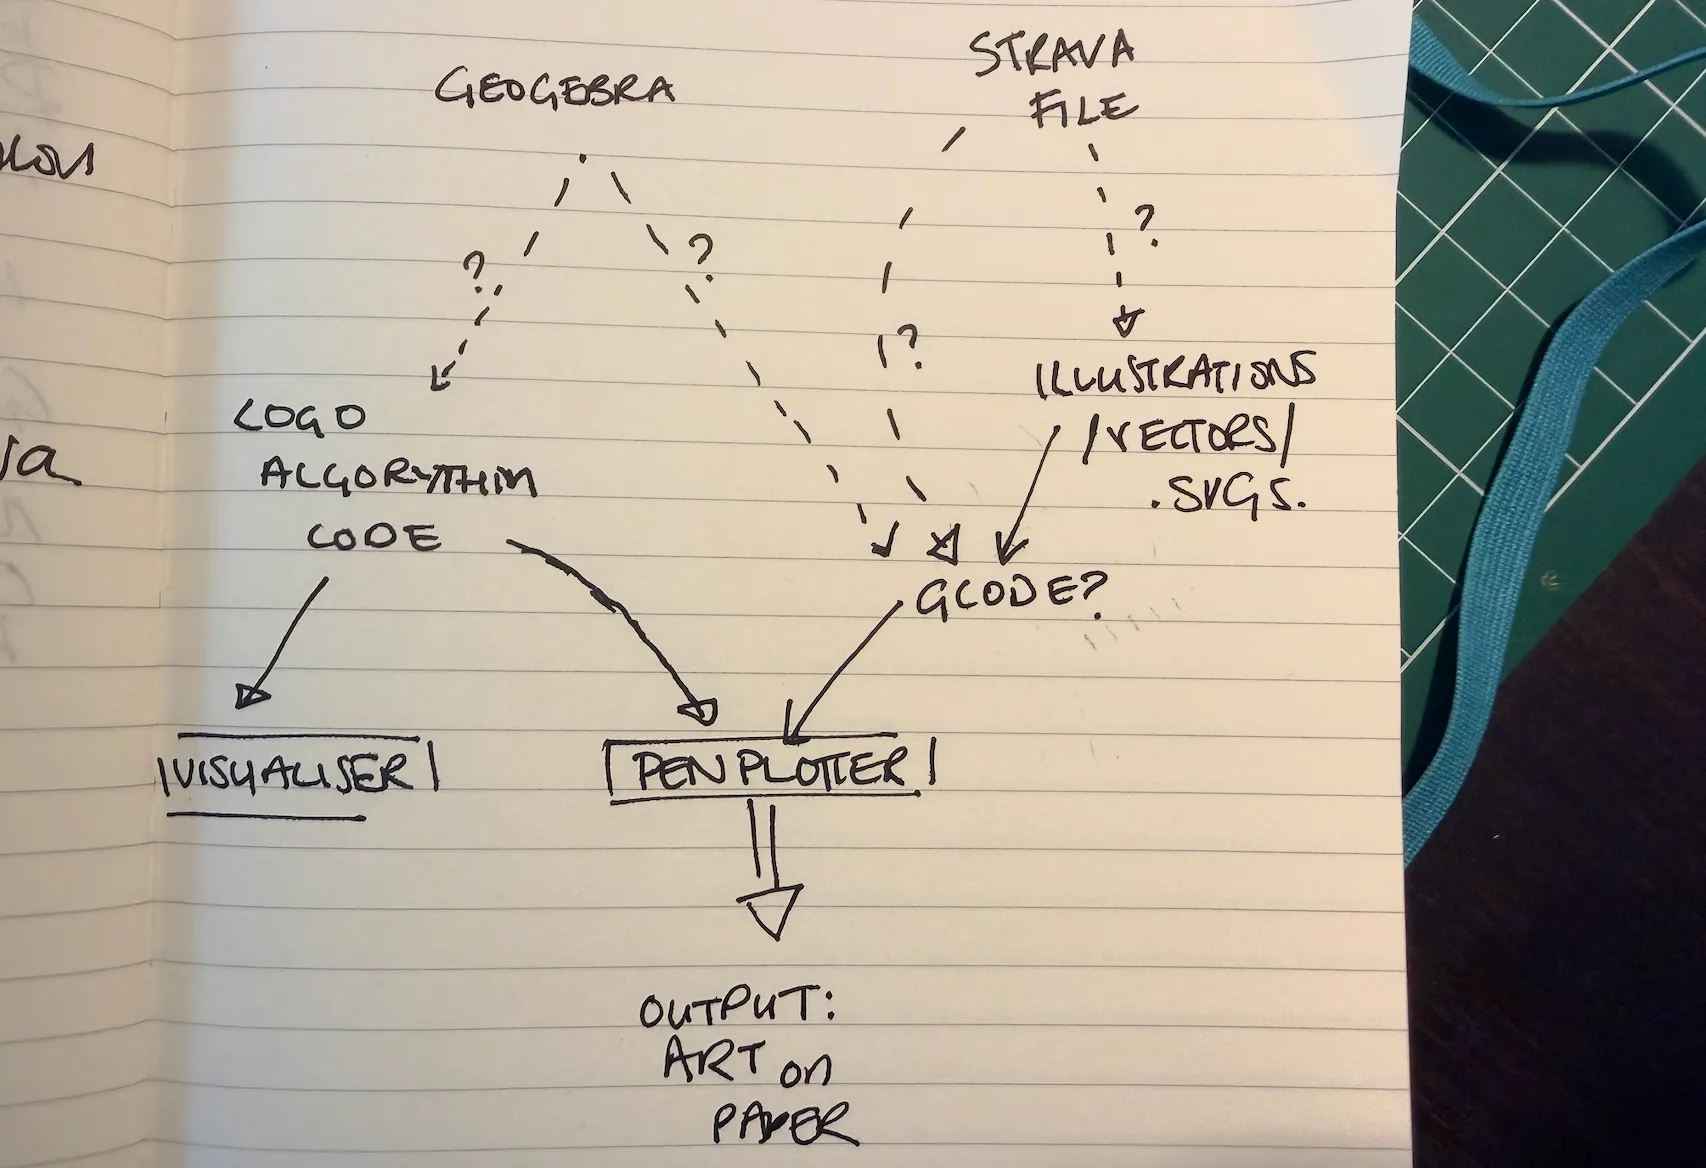
The intention behind it was sound. A means of travel to my goal: get everything into one format, feed that to my (as yet non-existent) machine, it draws, and hey presto, art. But the diagram was vague. What I started to see was that this was going to take rather more steps than I'd generously allowed myself to believe.
So that's what this blog, and the rest of my story, is about. It's a plan, but it's also me documenting and marking my own homework in public, which every designer knows is the fastest possible way to discover your mistakes.
The Project Analysis…
Obviously, my little half-arsed sketch was found wanting. I had the shape of a plan out of my head and onto paper, but sixty seconds of biro is not, it turns out, a rigorous architecture phase for something I intend to spend the next 4 to 6 months building. Who knew. (I knew. I do this professionally.)
So I sat back down with my second cup of tea to flesh it out, idea by idea, source by source, with the goal of reaching some level of prioritisation, a critical path, and ultimately a roadmap to my own delivery. What actually happened was my inner child took the opportunity to remind me of more ideas for the list. Somewhere in the middle of my SVG notes, I thought about star charts, which of course is what a Strava route is, but flattened. Which is what a coastline is. And once coastlines were in my head, I started thinking about town maps, shipping forecast areas and even sound waves. By the time I was done, the list had grown by 50% and was showing no sign of stopping.
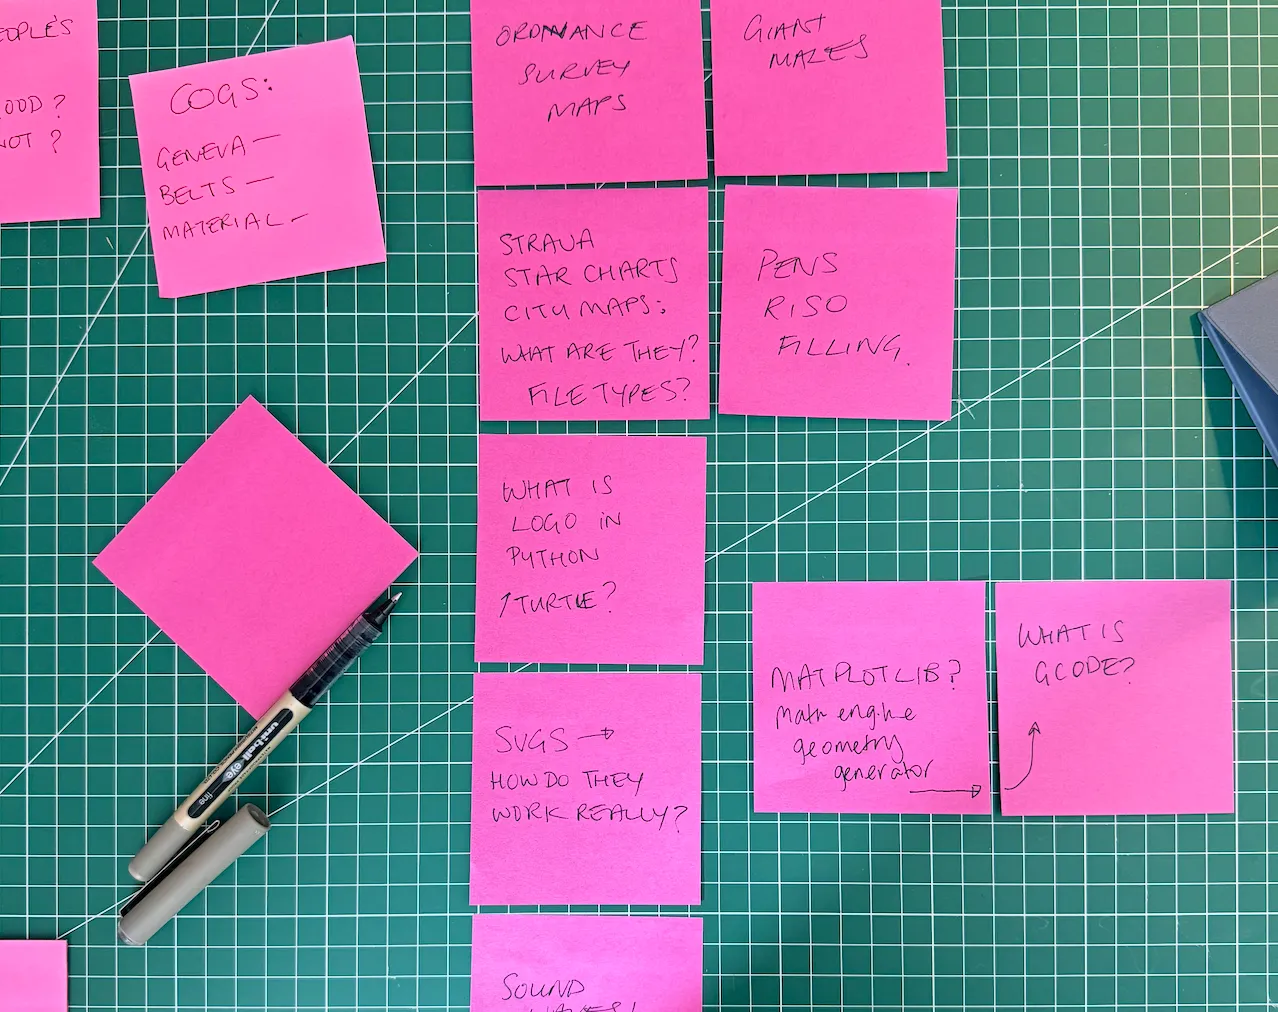
In my day job this is called scope creep, and it triggers a difficult meeting. At home it's called a backlog, and it triggers a third cup of tea. I wanted them all. I didn't want to be sensible and pick just two. So the plan began with making sure there was space for each, as long as there was a technically feasible scope (as I currently understood it, which, spoiler, was optimistically). There must have been some way to manage all this. It was time for some early requirements.
Analysis 1/6: Logo/Turtle, algorithmic code
Why: I recently wrote about Logo, and one of my earliest memories of sitting in front of a computer. In a world where everything is fast-paced and AI-driven, this is my tribute back to that time, sitting on the classroom floor, face to face with the turtle.
The ask:
- Write a few lines of code and have my machine draw the result, with no steps in between.
- Change one number and get a completely different picture.
- Draw a shape whose exact size I already know, so I can check for accuracy.
- Draw forms that would be impossible, or unbearably tedious, by hand.
Analysis 2/6: Illustrator artwork
Why: I do a lot of illustration in Procreate and Illustrator, and this feels like the logical step. Not a print of a drawing, which, if you get really close, is just a machine spraying dots at paper. An actual pen, moving, making each line in real time. And what's more, what happens if I swap the final part of that artwork journey for a crayon, a fountain pen, a potato? (The potato is currently out of scope. Currently.)
The ask:
- Draw the way I already do, and have my machine redraw it in ink.
- It must be proportional: 50 mm wide in the file measures 50 mm on the paper.
- Lettering that looks handwritten rather than printed.
- If the file contains something a pen physically can't do, the software tells me which bit and why, before it starts.
Analysis 3/6: GeoGebra constructions
Why: I'll be honest, this one started as my secret love of Spirograph. The plastic wheel, a pencil, and the slightly frustrating business of keeping the cog engaged. I don't remember who gifted me my first spiro set as a child, but it was a travel set with no instructions, and what I created felt like discovering something for the first time on behalf of humankind. GeoGebra is the grown-up version of that feeling, an online platform that lets anyone learn more about maths and geometry. How might I let my findings escape the digital world and land on paper…
The ask:
- Circles and straight edges. There should be simplicity to this.
- The construction layers in one pen, and the finished pattern over the top in another.
- Exact repeatability. Same construction, same result, every time.
- Change one number: six-fold to eight-fold to twelve-fold stars.
- Lines that meet where they are supposed to meet, with shadeable areas.
Analysis 4/6: Strava data
Why: I don't cycle. I don't even own a bike. I do, however, own several opinions about people who do, and know a lot of them, each with a folder full of routes they're quietly pleased with. Right now that data is a thin orange line on a phone screen that nobody looks at twice. Drawn properly, in ink, on paper: maybe something worth keeping. Worth celebrating, even.
The ask:
- Take a real recorded route and draw it at a size I choose.
- Keep the shape true, no squashing it to fit the page.
- Room for a title, a date, a distance. The bits that make it a keepsake rather than a printout.
- Work for anyone's route, not just one carefully chosen file.
Analysis 5/6: Coastlines and town maps
Why: There was always something riveting about rolling out maps and poring over them, setting intentions and team plans, working out where X marks the spot. A map with everything on it is functional. A map with almost everything stripped away is symbolic, and it becomes something the viewer must give a part of themselves to before it means anything.
The ask:
- A stretch of coast as one unbroken line, end to end.
- Roads only, or rivers only, or elevation marks. I decide the level of detail.
- Something that still holds up printed large.
Analysis 6/6: Star charts
Why: 1990 to 2000. Titan A.E., Contact, Star Trek: TNG, Hubble pictures turning up on the news in a decade when the news was mostly uninteresting to a ten-year-old. Despite my obsession with NASA at the time, most of what I know about Space (the one place that hadn't been corrupted by capitalism) I absorbed sideways, from the films, tv and robots (remember JINX?) of the '90s. Very little of it was accurate, but I think all of it left a very inspirational mark.
The ask:
- The actual sky from one location, at one point in time, in a circular disc format or a semicircular horizon view.
- Bigger dots for brighter stars, so it still reads from across the room.
- Optional constellation lines and names, so the pattern is there for anyone looking.
Next: Roadmaps, feasibilities and prioritisation. Bring your own tea ... you're going to want to crack open the biscuits.